
The NIVAS Bangkok index
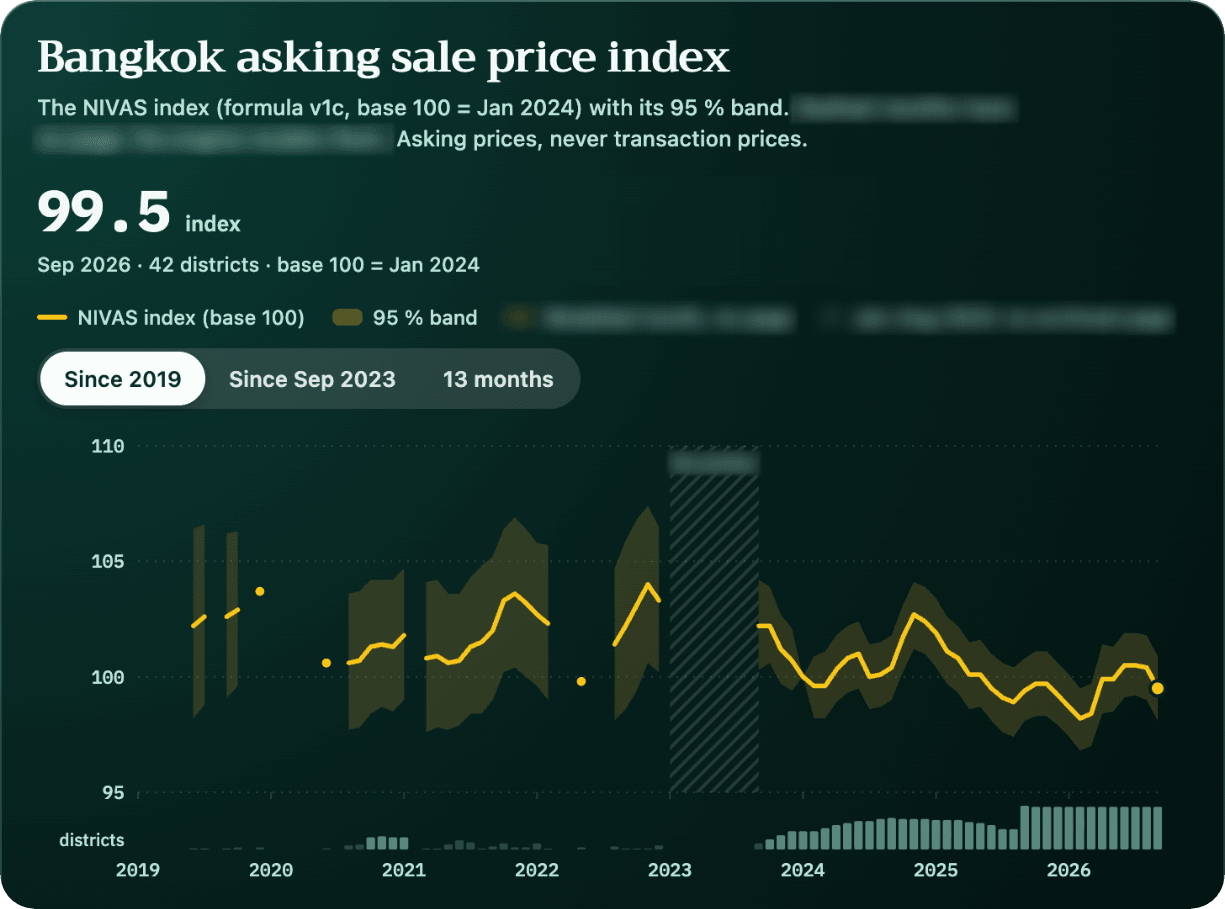
The asking sale price of Bangkok condominiums, month by month since June 2019, as one continuous series.
Built on asking prices, never transaction prices.
Monthly series. It updates when a new month of data is published. Latest month: September 2026.
Abstract
The NIVAS Bangkok index follows the asking sale price per square metre of Bangkok condominiums, month by month from June 2019, as one continuous series with a 95 % band around every month (January 2024 = 100). It is built from published district-level asking-price averages, weighted by each district’s number of condominium projects, and a statistical model joins the early and the recent periods of the data into a single curve while showing how uncertain each month is. The series measures what sellers ask, never what buyers finally pay, and it is neither an appraisal nor advice. The formula is documented and versioned (version 1.0, formula v1c), and the figures are revised under a stated policy.
Version 1.0 · formula v1c · October 2026
Key facts
- Measures
- Asking sale price per m²
- Bangkok condominiums; base 100 = January 2024.
- Period
- June 2019 – September 2026
- 67 monthly points published between June 2019 and September 2026, joined into one continuous series.
- Coverage
- Bangkok · sale
- 45 of Bangkok’s 50 districts observed, each weighted by its number of condominium projects.
- Updates
- Monthly series
- One point per month, added when a new month of data is published.
- Version
- 1.0 · formula v1c
- October 2026; documented and versioned.
Facts as of 31 October 2026.
The method, in plain words
- 1
Published averages
The index starts from published district-level averages of the asking sale price per square metre of Bangkok condominiums.
- 2
Weighted by stock
Each district counts by its number of condominium projects.
- 3
One continuous curve
A statistical model joins the early and the recent periods of the data into a single curve, month by month from June 2019. Data before 2023 is a sparse history, and nothing covers January to August 2023: the hatched gap on the chart. The curve is joined across that eight-month gap.
- 4
A band around every month
Every month carries a 95 % band that shows how uncertain it is.
How to read it
Asking prices, never transaction prices
The series measures what sellers ask, never what buyers finally pay. It is neither an appraisal nor advice.
Your listings stay yours
Data from NIVAS members’ listings never enters the index.
Versioned and revised under a stated policy
The formula is documented and versioned: version 1.0, formula v1c. A later month can revise earlier ones: in the white paper’s test, six more months of data moved a published month by at most 2.13 %, twelve months by at most 2.19 %. A change of method that would move any published month by more than 0.5 % is held for review before release.
The white paper
The method in full. Version 1.0 · formula v1c · October 2026

Bring your Bangkok real-estate workflow together.
NIVAS is by invitation, for agencies and freelance agents in Bangkok. Tell us how you work and we will get back to you.
- 1You send this request For your agency, or as a freelance agent.
- 2We reply personally To the e-mail address you give.
- 3Your own code Your agency or group receives its own invitation code; the agency then adds its agents as seats.